
 Featured
Next.jsTypeScriptPythonpandasData Analysis
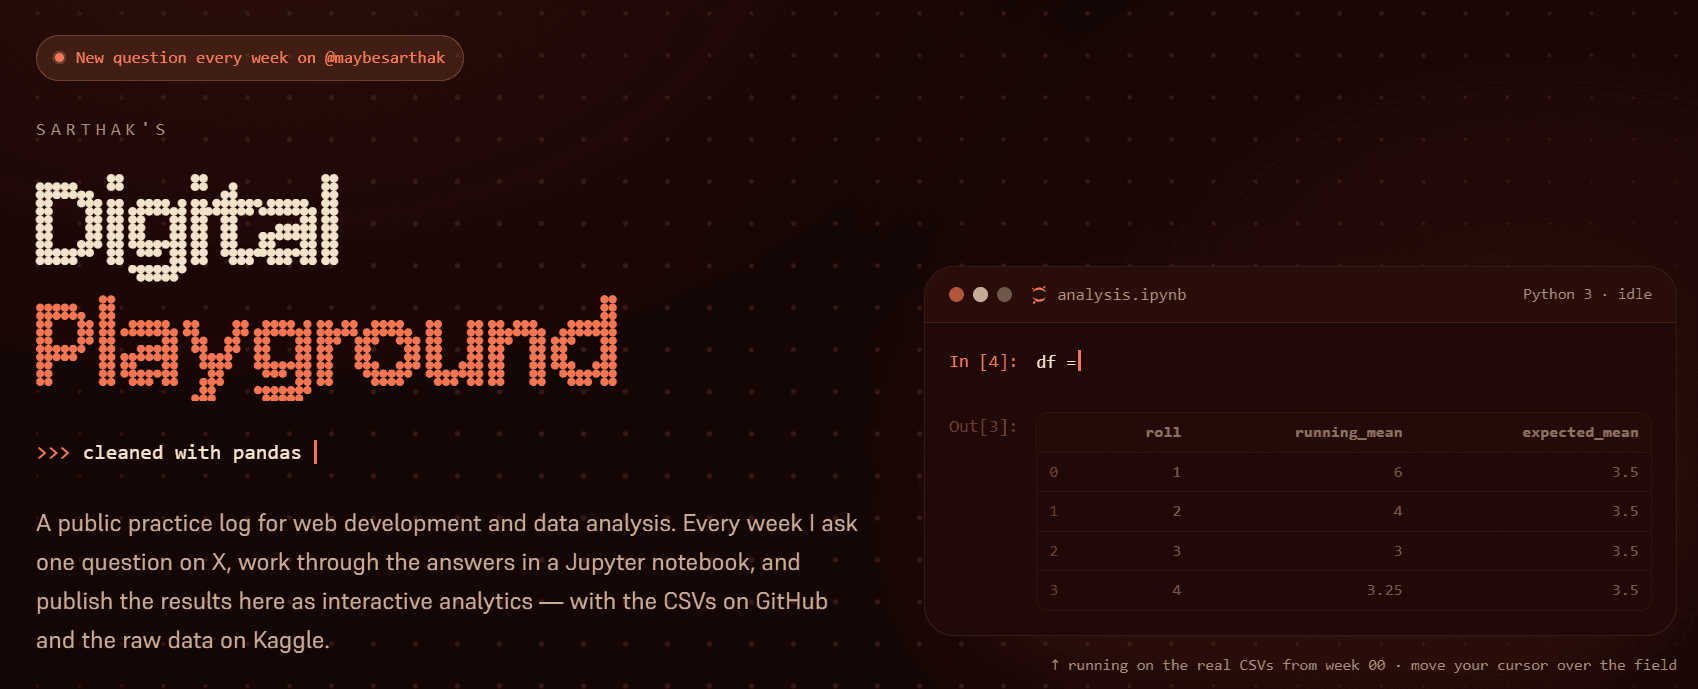
A public practice log for data analysis. Each week I ask a question on X, collect the answers, work through them in Jupyter with pandas and NumPy, and publish the result as interactive charts — cleaned CSVs and notebooks on GitHub, raw datasets on Kaggle.
Visit live siteSource